Share Market Valuations – is it cheap or expensive?
The Australian Stock Exchange (ASX) has been trading in a reasonably tight trading range, i.e. circa 6000 to 6300 for the last 5 months and then all of sudden over the last 2 to 3 weeks broken through the upper range, largely following the lead of the US share market and the announcement of a successful vaccine trials by Pfizer and Moderna.
It’s not that we are pessimistic about the vaccine’s success rates or an economic recovery in 2021, it’s just that we question whether company earnings will recover as fast as the share market is pricing them to, without any speed bumps or delays along the way.
I think it is important to note that we are not advocating a 100% cash position but rather holding an underweight (circa 10% – 15%) to the neutral share market benchmark allocation vs your given risk profile, i.e. Moderate, Balanced etc. As well as investing any excess cash in stages we continue to take a conservative approach right now in uncharted waters. With many countries still in lock down, or heavily imposed social restrictions, our base case is that the world will not return to normal in the next 3 to 6 months.
The following charts are based on the market close on the 19th of November 2020 (last Thursday) and reiterate why we feel there is a disconnect between current share prices and the underlying fundamentals, i.e. earnings.
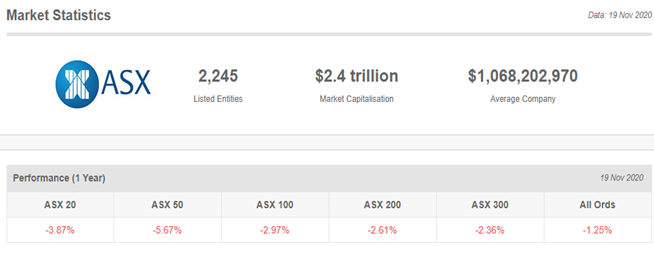
Price / Earnings (P/E) Ratio – Australian Stock Exchange (ASX)
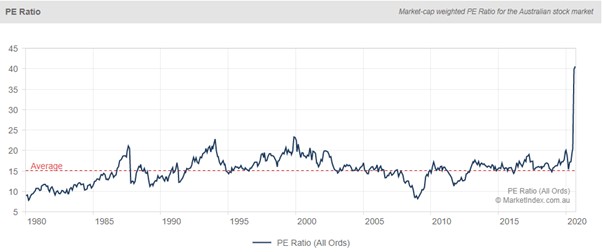
As the name suggests, a P/E ratio is calculated by dividing a company’s share price by its earnings per share (EPS). EPS can be measured as either a trailing EPS (from the last reporting period) or a forward EPS (projected for the next reporting period). Depending on which of these is used in the denominator, we can derive either a forward P/E or trailing P/E.
The chart below, which goes back to 1980, illustrates how extreme valuations have become and hence it is perhaps not surprising that leads us to believe the ASX is overvalued right now.
So, is the US market better value?
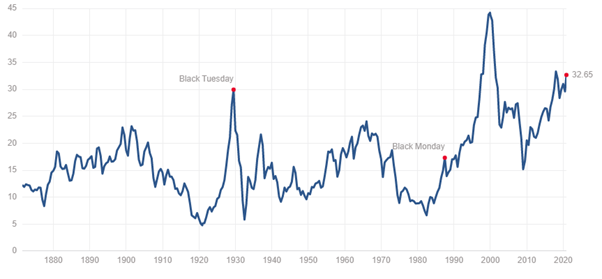
The American S&P 500 Index P/E Ratio (illustrated below) is at a current (19/11/2020) level of 32.6, up from 22.22 last quarter and up from 21.75 one year ago. This is a change of 40.62% from last quarter and 43.67% from one year ago.
The Shiller Price earnings ratio is based on average inflation-adjusted earnings from the previous 10 years, known as the Cyclically Adjusted PE Ratio (CAPE Ratio). The Shiller PE is 27% higher than the recent 20-year average of 25.6.
Company Earnings - Australia
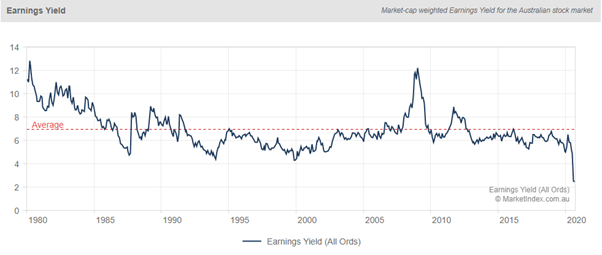
Well we know what the P of the P/E ratio is so what about company earnings? One cause of the high P/E ratio has been a collapse in earnings - shown below. This leads us to conclude that earnings need to deliver an unprecedented recovery to support current prices or share prices are overvalued and we are in store for a correction or we get a bit of both, i.e. company earnings improve and shares prices retrace. While there is a raft of Government and Central Bank stimulus measures the gap between prices and earnings seems extreme to us right now and something will eventually need to adjust.
What about economic improvement in 2021?
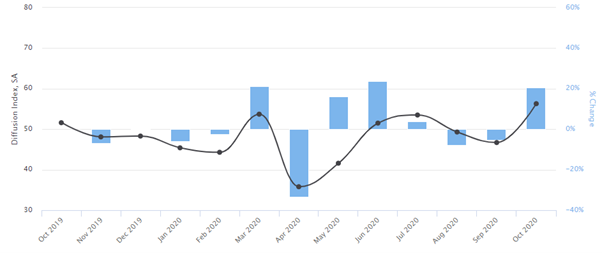
The Purchasing Managers Index (PMI) is a measure of the prevailing direction of economic trends in manufacturing. The PMI is based on a monthly survey of supply chain managers across various industries and based on five major survey areas: new orders, inventory levels, production, supplier deliveries, and employment. The surveys include questions about business conditions and any changes, whether it be improving, no changes, or deteriorating.
The value and movements in the PMI and its components can provide useful insight to business decision makers, market analysts, and investors, and is a leading indicator of overall economic activity. The headline PMI is a number from 0 to 100. A PMI above 50 represents an expansion when compared with the previous month. A PMI reading under 50 represents a contraction, and a reading at 50 indicates no change.
Below is the PMI for Australia which shows it fell below 50 in December 2019 and now jumped above 50 in October. This is certainly a positive sign for broader economic activity. The key question again is whether it is enough to super charge earnings to justify current share prices heading into 2021?
Dividends and low interest rates
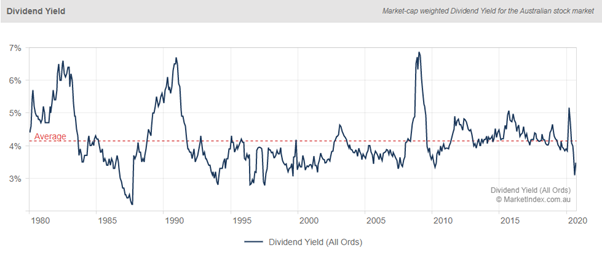
Even though many companies have cut their dividends to secure their balance sheets, dividend yields (plus in many cases a franking credit) are still looking attractive vs low cash rates. This is of course largely dependent that the share market doesn’t experience a correction. Then the dividend yield may pale in insignificance vs the drop in portfolio value, i.e. be careful not to focus too heavily on yield alone.
Summary
Capital protection is our primary focus when we approach wealth creation. It doesn’t mean we don’t lose money from time to time as nobody can predict the share market however it does mean we understand investors are loss adverse and want to protect what they have worked hard for.
With that in mind we then consider whether we are being rewarded for the level of risk we are taking when we invest in any asset besides cash. Until share market valuations improve or we gain more confidence in the earnings recovery to support current prices we will continue to hold an underweight to neutral allocation to growth assets. That ultimately means we will still participate in the upside if share markets continue to rally however we will continue to have a capital protection tilt embedded in our portfolios.
Please do not hesitate to contact us if you have any questions.
Kind regards,
The Coastline Private Wealth Team.


