


CommSec State of States report – April 2021
Each quarter CommSec attempts to find out how the Australian states and territories are performing by analysing eight key indicators:
- Economic growth
- Retail spending
- Equipment investment
- Unemployment
- Construction work done.
- Population growth
- Housing finance
- Dwelling commencements.
Just as the Reserve Bank uses long-term averages to determine the level of “normal” interest rates; CommSec have done the same with the economic indicators. For each state and territory, latest readings for the key indicators were compared with decade averages – that is, against the “normal” performance.
Now in its 12th year, the ‘State of the States’ report also includes a section comparing annual growth rates for the eight key indicators across the states and territories as well as Australia as a whole. This enables another point of comparison – in terms of economic momentum.
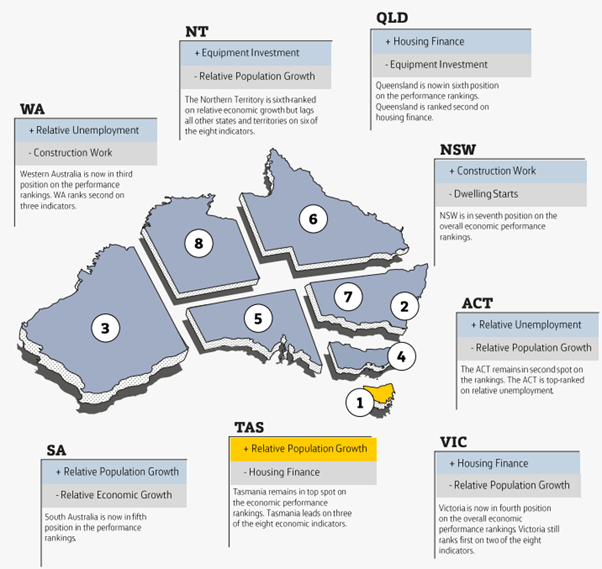
Tasmania has now been on top for five straight surveys – either shared with another state or territory or in its own right.
The second ranking for the ACT is its highest ranking for four years (April 2017).
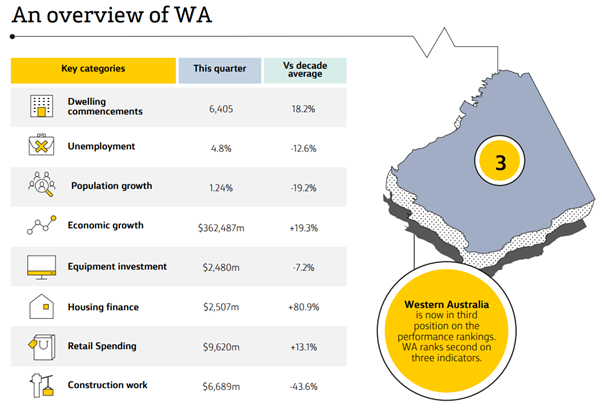
Western Australia has jumped from equal sixth to outright third. The third position for WA is its highest ranking in six years (April 2015). Prior to April 2015, Western Australia held top spot or second spot for over five years. WA now ranks second on relative economic growth, dwelling starts and relative unemployment.
Victoria eases from joint third to fourth position. Victoria still ranks first on construction work done as well as housing finance however struggling on relative unemployment and population growth.
South Australia moves from joint third to outright fifth on the performance rankings.
Queensland is now outright sixth. It is ranked second spot for housing finance, however eighth for both economic growth and equipment investment.
NSW is seventh in the rankings, its lowest ranking for over 9 years.
NT is ranked eighth, lagging all other states and territories on 6 indicators.
Click here for a full copy of the CommSec State of State April 2021 Report.
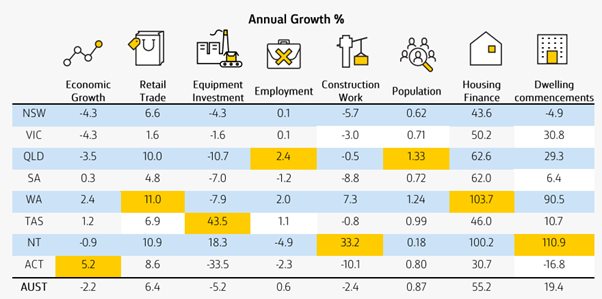
Annual Growth Rates
The State of the States report assesses economic performance by looking at the most recent result – such as retail trade or construction – and compares that with the ‘normal’ experience. And by ‘normal experience’, we define this as the decade average.
A resident of the state or territory can therefore assess whether they are experiencing relatively better economic times. Comparing states or territories on the same criteria determines which state or territory is performing the best on a certain indicator.
In addition to relative economic performance, some are also interested in economic momentum. That is, annual changes in key indicators. A state/territory may have been under performing, but if annual growth is rising, then this suggests that performance has scope to improve.
Please do not hesitate to contact us if you have any questions.
Kind regards,
The Coastline Private Wealth Team.


