


VOLATILITY RETURNS WITH A VENGEANCE
Heightened uncertainty around the Trump administration’s new tariffs has shaken markets in the past week.
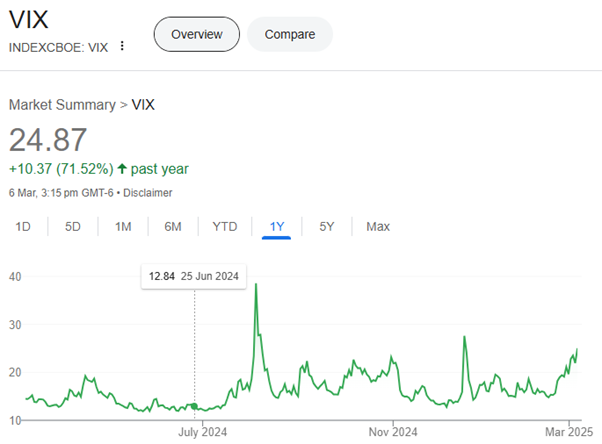
The following chart shows the VIX index for the last 12 months, which is a measure designed to produce a constant 30-day expected volatility of the US share market (S&P 500) and is one of the most recognised measures of volatility. The more dramatic the price swings are in the index, the higher the level of volatility, and vice versa.
Volatility, or how fast prices change, is often seen as a way to gauge market sentiment, and in particular the degree of fear among market participants.
In general, a VIX reading below 20 suggests a perceived low-risk environment, while a reading above 20 is indicative of a period of higher volatility.
TIME FRAMES AND PERSPECTIVE
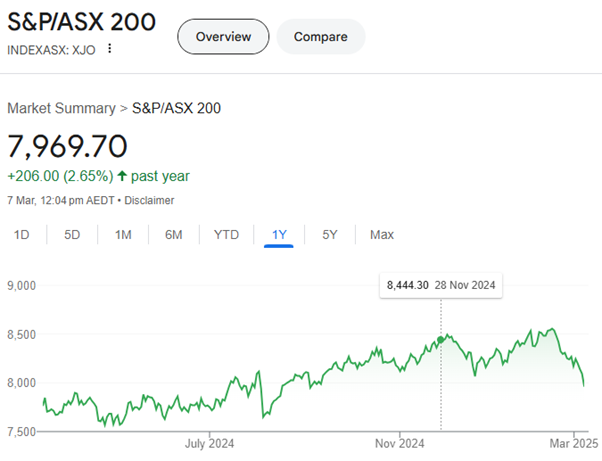
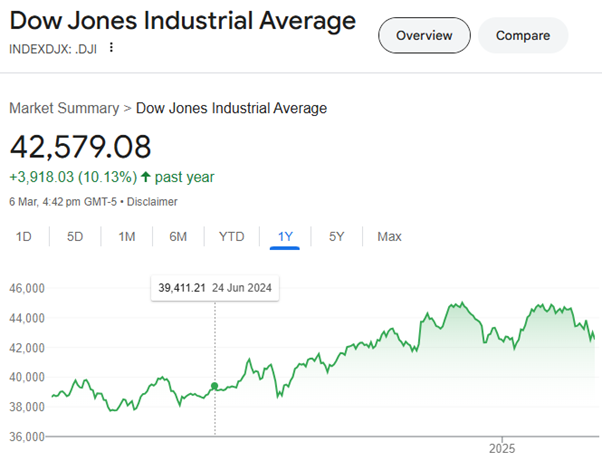
While the Australian and US share market has fallen around 5-6% in the last 4 weeks the 1-year performance remains positive. Please note the charts below do not include income, or franking credits.
It was not unexpected that when President Trump was elected that trade tariffs would be imposed. It is just that now we are understanding the magnitude and retaliation. Even with tariffs taking effect, we believe that Trump continues to view them as a negotiation tool. He has still not adopted the universal tariffs that he floated on the campaign trail. Nor has he ratcheted up the tariff on China’s imports to 60%.
Importantly don’t panic. Make sure you understand your starting allocation to growth assets and hold some extra cash during this period. Sentiment has become noticeably oversold.
One of Warren Buffets most famous sayings is “be greedy when people are fearful and be fearful when people are greedy”. Does this represent an opportunity?
Copyright © 2025 Coastline Private Wealth, All rights reserved.
Our mailing address is:
PO Box 2082
Churchlands WA 6018


