


Setting realistic expectations: Vanguard asset class forecasts 2024
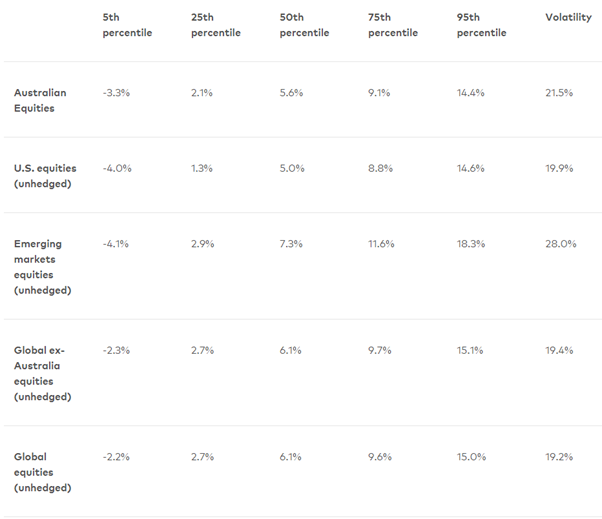
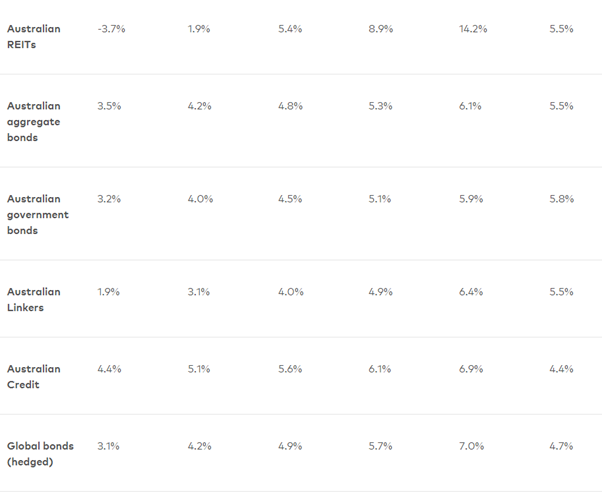
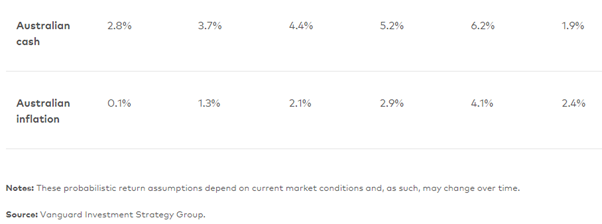
This table presents Vanguard’s, one of the world’s largest investment managers, expectations for the annualised performance of various share market (Equity) and fixed income indexes over the next decade.
These forecasts are prepared using the Vanguard Capital Markets Model® (VCMM), a powerful forecasting tool used for setting reasonable investment return expectations and evaluating the risk-and-return trade-offs inherent in portfolio decisions.
The model presents a potential range of portfolio return outcomes and the probabilities of achieving return objectives or realizing downside-risk events across global asset classes.
Learn more about our views on the global economic outlook by downloading the full economic and market outlook for 2024.

About the Vanguard Capital Markets Model
IMPORTANT: The projections and other information generated by the Vanguard Capital Markets Model regarding the likelihood of various investment outcomes are hypothetical in nature, do not reflect actual investment results, and are not guarantees of future results. VCMM results will vary with each use and over time.
The VCMM projections are based on a statistical analysis of historical data. Future returns may behave differently from the historical patterns captured in the VCMM. More important, the VCMM may be underestimating extreme negative scenarios unobserved in the historical period on which the model estimation is based.
The VCMM is a proprietary financial simulation tool developed and maintained by Vanguard’s Investment Strategy Group. The model forecasts distributions of future returns for a wide array of broad asset classes. Those asset classes include U.S. and international equity markets, several maturities of the U.S. Treasury and corporate fixed income markets, international fixed income markets, U.S. money markets, commodities, and certain alternative investment strategies. The theoretical and empirical foundation for the Vanguard Capital Markets Model is that the returns of various asset classes reflect the compensation investors require for bearing different types of systematic risk (beta). At the core of the model are estimates of the dynamic statistical relationship between risk factors and asset returns, obtained from statistical analysis based on available monthly financial and economic data. Using a system of estimated equations, the model then applies a Monte Carlo simulation method to project the estimated interrelationships among risk factors and asset classes as well as uncertainty and randomness over time. The model generates a large set of simulated outcomes for each asset class over several time horizons. Forecasts are obtained by computing measures of central tendency in these simulations. Results produced by the tool will vary with each use and over time.
The primary value of the VCMM is in its application to analysing potential client portfolios. VCMM asset-class forecasts— comprising distributions of expected returns, volatilities, and correlations—are key to the evaluation of potential downside risks, various risk–return trade-offs, and the diversification benefits of various asset classes. Although central tendencies are generated in any return distribution, Vanguard stresses that focusing on the full range of potential outcomes for the assets considered, such as the data presented in this paper, is the most effective way to use VCMM output.
The VCMM seeks to represent the uncertainty in the forecast by generating a wide range of potential outcomes. It is important to recognize that the VCMM does not impose “normality” on the return distributions, but rather is influenced by the so-called fat tails and skewness in the empirical distribution of modelled asset-class returns. Within the range of outcomes, individual experiences can be quite different, underscoring the varied nature of potential future paths. Indeed, this is a key reason why we approach asset-return outlooks in a distributional framework.
Indexes for VCMM simulations
The long-term returns of our hypothetical portfolios are based on data for the appropriate market indexes through September 30, 2023. We chose these benchmarks to provide the most complete history possible, and we apportioned the global allocations to align with Vanguard’s guidance in constructing diversified portfolios. Asset classes and their representative forecast indexes are as follows:
- Australian equities: MSCI Australia Index.
- Global ex-Australia equities: MSCI All Country World ex-Australia Index.
- Australian REITs: FTSE EPRA/NAREIT Australian Index.
- Commodity futures: Bloomberg Commodity Index in AUD (unhedged).
- Australian cash: Australian 1-Month Government Bond.
- Australian Government Bonds / Treasury Index: Bloomberg Barclays Australian Aggregate Treasury Index.
- Australian credit bonds: Bloomberg Barclays Australian Credit Index.
- Australian bonds: Bloomberg Barclays Australian Aggregate Bond Index.
- Global ex-Australia bonds: Bloomberg Barclays Global Aggregate ex-AUS Bond Index.
- Australian Linkers: Bloomberg Barclays Australia Inflation Linked Treasury Index.
- Short-term Treasury index: Bloomberg Barclays Australian Aggregate Treasury 1-5 Year Index.
- Long-term Treasury index: Bloomberg Barclays Australian Aggregate Treasury 10+ Year Index.
All equity indexes below are weighted by market capitalisation:
- Small-cap equities: Stocks with a market cap in the lowest two-thirds of the Russell 3000 Index.
- Large-cap equities: Stocks with a market cap in the highest one-third of the Russell 1000 Index.
- Growth equities: Stocks with a price/book ratio in the highest one-third of the Russell 1000 Index.
- Value equities: Stocks with a price/book ratio in the lowest one-third of the Russell 1000 Index.
Forward looking statements
This article contains certain 'forward looking' statements. Forward looking statements, opinions and estimates provided in this article are based on assumptions and contingencies which are subject to change without notice, as are statements about market and industry trends, which are based on interpretations of current market conditions. Forward-looking statements including projections, indications or guidance on future earnings or financial position and estimates are provided as a general guide only and should not be relied upon as an indication or guarantee of future performance. There can be no assurance that actual outcomes will not differ materially from these statements. To the full extent permitted by law, Vanguard Investments Australia Ltd (ABN 72 072 881 086 AFSL 227263) and its directors, officers, employees, advisers, agents and intermediaries disclaim any obligation or undertaking to release any updates or revisions to the information to reflect any change in expectations or assumptions.
Copyright © 2024 Coastline Private Wealth, All rights reserved.
Our mailing address is:
PO Box 2082
Churchlands WA 6018


