


CommSec State of States Report October 2025
Each quarter CommSec attempts to find out which state or territory is Australia’s economic leader. Now in its 17th year, the report also includes a section comparing annual growth rates for the eight key indicators across the states and territories as well as Australia as a whole, enabling comparisons in terms of economic momentum.
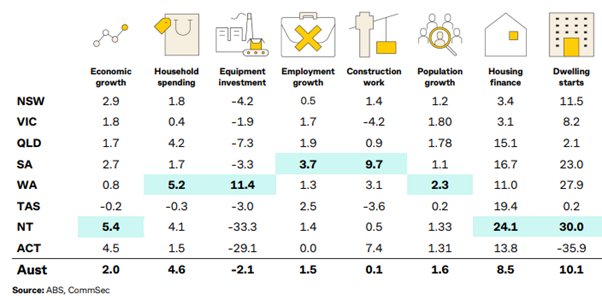
- Economic growth
- Retail spending
- Equipment investment
- Unemployment
- Construction work done.
- Population growth
- Housing finance
- Dwelling commencements.
Just as the Reserve Bank uses long-term averages to determine the level of “normal” interest rates; CommSec have done the same with the economic indicators. For each state and territory, latest readings for the key indicators were compared with decade averages – that is, against the “normal” performance.
Each quarter CommSec attempts to find out which state or territory is Australia’s economic leader. The report also includes a section comparing annual growth rates for the eight key indicators across the states and territories as well as Australia as a whole, enabling comparisons in terms of economic momentum.
To read the full October 2025 report click here
Overall, the economic performance of Australia’s states and territories is being supported by a combination of slowing inflation, falling interest rates, rising real wages, robust government spending and a solid labour market.
While private sector activity is improving, business investment remains subdued, job growth is slowing, and weaker public sector activity could eventually push up unemployment and slow wages growth. The future path will depend on the resiliency of the labour market , further interest rate cuts and global trade policies.
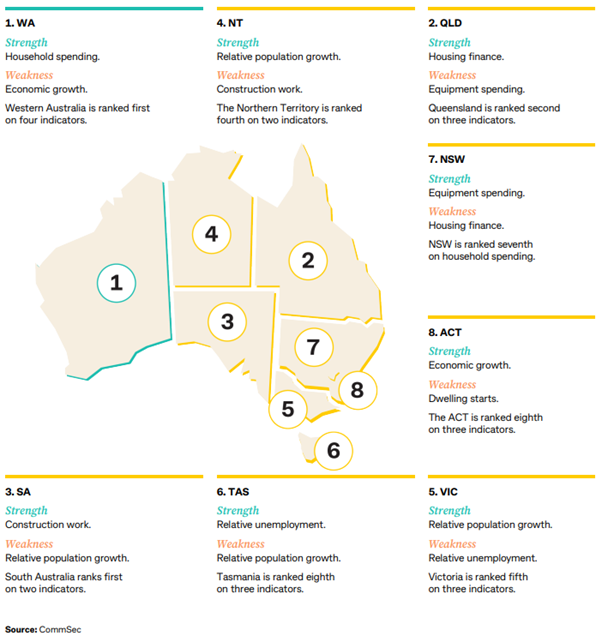
In the October 2025 edition of the State of the States:
Western Australia leads the national performance rankings for the fifth successive report. The state is ranked first on four of the eight economic indicators.
Queensland has climbed to second from third place driven by a rebound in household spending.
South Australia slips to third.
The Northern Territory is the big improver, jumping from eighth to fourth spot, a position it last held in October 2016. The ‘Top End’ is ranked first for relative population growth, supporting domestic spending.
The South-Eastern states and territories are in a tight cluster on the table, held-back by still-sluggish private sector activity.
Victoria drops from fourth to fifth place, with support from robust population growth.
Tasmania dips from fifth to sixth spot due to anaemic private sector demand.
NSW falls to seventh from equal sixth position as the transition from public to private sector-led growth begins to take hold.
The ACT drops back to eighth place as public demand eases.
Growth Leaders
The State of the States report assesses economic performance by looking at the most recent results—such as retail trade or construction—and compares that with the ‘normal experience’. And by ‘normal experience’, we define this as the decade average.
A resident of the state or territory can therefore assess whether they are experiencing relatively better economic times. Comparing states or territories on the same criteria determines which state or territory is performing the best on a certain indicator.
In addition to relative economic performance, some are also interested in economic momentum. That is, annual changes to the key indicators. A state or territory may have been under-performing, but if annual growth is strengthening, then this suggests that performance has scope to improve.
As noted above, annual growth rates are a better tool of measurement of economic performance for the Northern Territory as the small, open economy is buffeted by big projects (such as LNG construction over 2012–18 period which inflated decade averages).
Copyright © 2025 Coastline Private Wealth, All rights reserved.
Our mailing address is:
PO Box 2082
Churchlands WA 6018


